Support Vector Machines
(This notebook was created for a workshop at RV College of Engineering on 6th Sep 2021)
Support vector machine(SVM) belongs to the supervised learning class, and can be used for both regression and classification purposes.
The support vector machine’s main intent is to create a line, or a hyperplane(decision boundary), that can separate data points in an n-dimensional space to classify further data points into one of the classes determined.
The hyperplanes are created due to the SVM selecting the closest points. These close points are known as support vectors, and that is where the name of support vector machines originates from. The whole SVM algorithm can be visualized as -

Linear SVM
Consider this separation of classes. Fairly straightforward to separate using a 2D line

One possible set of lines -

The algorithm finds the points closest to the hyperplane.
The distance between the points and the hyperplane is known as the margin
The goal is to maximise this margin.
Therefore, the green line where there’s the highest margin is the hyperplane - for classification.

[ ]:
import pandas as pd
import matplotlib.pyplot as plt

from sklearn.svm import *
from sklearn.metrics import accuracy_score
from sklearn.model_selection import train_test_split
from sklearn.metrics import confusion_matrix # this creates a confusion matrix
from sklearn.metrics import plot_confusion_matrix # draws a confusion matrix
from sklearn import datasets
[ ]:
dir(datasets)
['__all__',
 '__builtins__',
 '__cached__',
 '__doc__',
 '__file__',
 '__loader__',
 '__name__',
 '__package__',
 '__path__',
 '__spec__',
 '_base',
 '_california_housing',
 '_covtype',
 '_kddcup99',
 '_lfw',
 '_olivetti_faces',
 '_openml',
 '_rcv1',
 '_samples_generator',
 '_species_distributions',
 '_svmlight_format_fast',
 '_svmlight_format_io',
 '_twenty_newsgroups',
 'clear_data_home',
 'dump_svmlight_file',
 'fetch_20newsgroups',
 'fetch_20newsgroups_vectorized',
 'fetch_california_housing',
 'fetch_covtype',
 'fetch_kddcup99',
 'fetch_lfw_pairs',
 'fetch_lfw_people',
 'fetch_olivetti_faces',
 'fetch_openml',
 'fetch_rcv1',
 'fetch_species_distributions',
 'get_data_home',
 'load_boston',
 'load_breast_cancer',
 'load_diabetes',
 'load_digits',
 'load_files',
 'load_iris',
 'load_linnerud',
 'load_sample_image',
 'load_sample_images',
 'load_svmlight_file',
 'load_svmlight_files',
 'load_wine',
 'make_biclusters',
 'make_blobs',
 'make_checkerboard',
 'make_circles',
 'make_classification',
 'make_friedman1',
 'make_friedman2',
 'make_friedman3',
 'make_gaussian_quantiles',
 'make_hastie_10_2',
 'make_low_rank_matrix',
 'make_moons',
 'make_multilabel_classification',
 'make_regression',
 'make_s_curve',
 'make_sparse_coded_signal',
 'make_sparse_spd_matrix',
 'make_sparse_uncorrelated',
 'make_spd_matrix',
 'make_swiss_roll']
[ ]:
# load iris dataset
iris = datasets.load_iris()
iris_df=pd.DataFrame(iris.data)
iris_df['class']=iris.target

iris_df.columns=['sepal_len', 'sepal_wid', 'petal_len', 'petal_wid', 'class']
iris_df
| sepal_len | sepal_wid | petal_len | petal_wid | class | |
|---|---|---|---|---|---|
| 0 | 5.1 | 3.5 | 1.4 | 0.2 | 0 |
| 1 | 4.9 | 3.0 | 1.4 | 0.2 | 0 |
| 2 | 4.7 | 3.2 | 1.3 | 0.2 | 0 |
| 3 | 4.6 | 3.1 | 1.5 | 0.2 | 0 |
| 4 | 5.0 | 3.6 | 1.4 | 0.2 | 0 |
| ... | ... | ... | ... | ... | ... |
| 145 | 6.7 | 3.0 | 5.2 | 2.3 | 2 |
| 146 | 6.3 | 2.5 | 5.0 | 1.9 | 2 |
| 147 | 6.5 | 3.0 | 5.2 | 2.0 | 2 |
| 148 | 6.2 | 3.4 | 5.4 | 2.3 | 2 |
| 149 | 5.9 | 3.0 | 5.1 | 1.8 | 2 |
150 rows × 5 columns
[ ]:
X = iris_df.drop(columns=['class'])
y = iris_df['class']
X_train, X_test, y_train, y_test= train_test_split(X, y, test_size= 0.30, random_state=0)
[ ]:
dir()
['In',
 'LinearSVC',
 'LinearSVR',
 'NuSVC',
 'NuSVR',
 'OneClassSVM',
 'Out',
 'SVC',
 'SVR',
 'X',
 'X_test',
 'X_train',
 '_',
 '_10',
 '_2',
 '_5',
 '_9',
 '__',
 '___',
 '__builtin__',
 '__builtins__',
 '__doc__',
 '__loader__',
 '__name__',
 '__package__',
 '__spec__',
 '_dh',
 '_i',
 '_i1',
 '_i10',
 '_i11',
 '_i12',
 '_i13',
 '_i14',
 '_i15',
 '_i16',
 '_i2',
 '_i3',
 '_i4',
 '_i5',
 '_i6',
 '_i7',
 '_i8',
 '_i9',
 '_ih',
 '_ii',
 '_iii',
 '_oh',
 '_sh',
 'accuracy_score',
 'confusion_matrix',
 'datasets',
 'exit',
 'get_ipython',
 'iris',
 'iris_df',
 'l1_min_c',
 'pd',
 'plot_confusion_matrix',
 'plt',
 'quit',
 'train_test_split',
 'y',
 'y_test',
 'y_train']
[ ]:
svm = LinearSVC()
svm.fit(X_train,y_train)
svm_pred = svm.predict(X_test)
/usr/local/lib/python3.7/dist-packages/sklearn/svm/_base.py:947: ConvergenceWarning: Liblinear failed to converge, increase the number of iterations.
  "the number of iterations.", ConvergenceWarning)
[ ]:
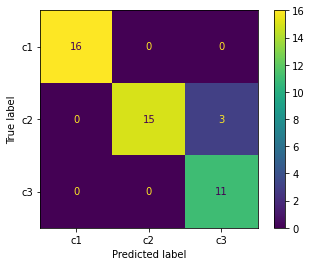
accuracy_score(y_test,svm_pred)
0.9333333333333333
[ ]:
plot_confusion_matrix(svm, X_test, y_test, display_labels=["c1","c2","c3"])
<sklearn.metrics._plot.confusion_matrix.ConfusionMatrixDisplay at 0x7f6ee7fee190>
[ ]:
iris_df["class"].unique()
array([0, 1, 2])
Terms :
Kernelling
Maximum Margin
Hyperplane